total tv & streaming viewership
Total TV continues to dominate time spent with video
Our time spent viewing content is increasingly fragmented: We’re streaming, we’re exploring YouTube — but more than anything, we’re enjoying TV.
Make no mistake: Total TV (linear + broadcaster streaming services) continues to dominate when it comes to video consumption. Add that to its high-attention platform and premium, brand-safe environment, Total TV is a clear winner for driving brand success.
Key findings from our latest Total TV & Streaming Viewership report:
- TV and streaming: Very few Canadians are “only streamers,” most are watching TV and streaming services
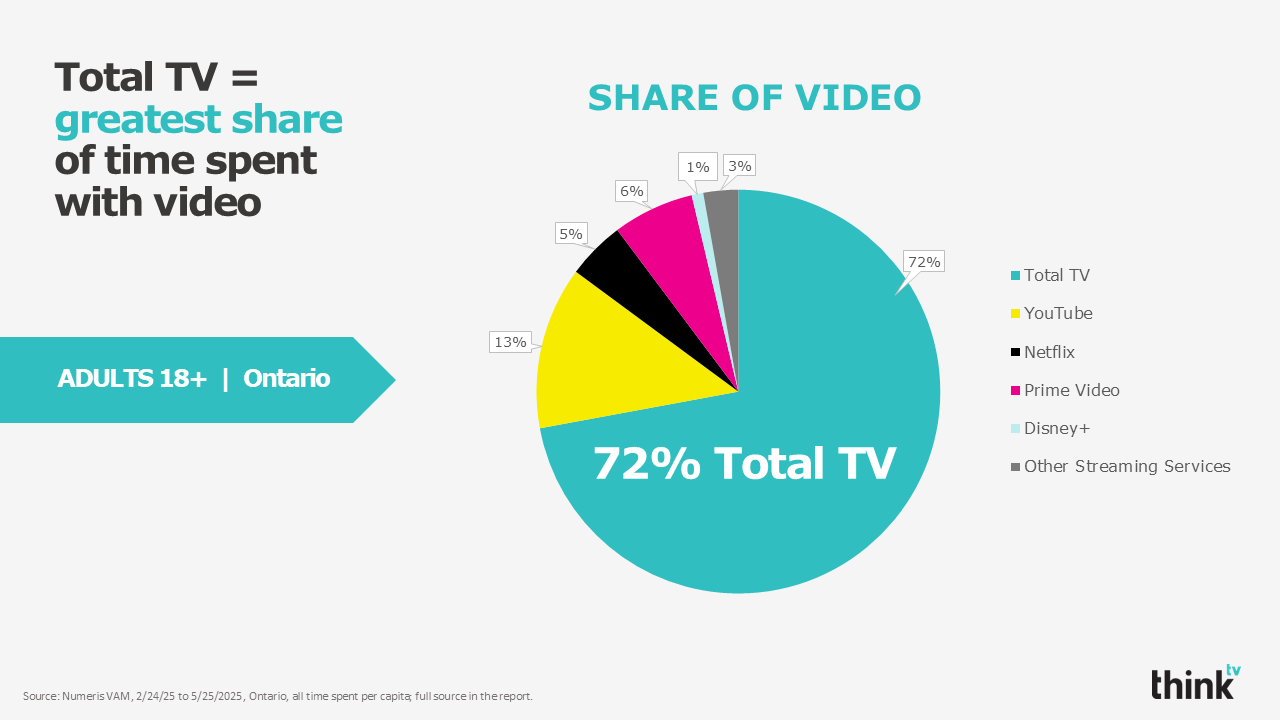
- Time spent: Total TV surpasses YouTube and the combined viewership of all streaming services across all key demos (A18+, A25-54, and A18-34). In fact, TV’s percentage of time spent with video went up over the past year, while YouTube went down.
- Canadians stream differently than Americans: Streaming is far more prevalent in the US, where streaming makes up 50% of viewing on a TV set. In Canada, that number is only 21%, with almost 80% going to linear TV, a viewing pattern that is more like the UK.
- Reach: Total TV delivers the highest average weekly reach, outperforming all streaming platforms, including YouTube
- TV dominates the big screen: Linear TV dominates big-screen viewing, commanding 80% of time spent (A18+)
- Quebec: The Quebec Franco population spends significantly less time streaming, so TV’s lead on reach and time spent is even greater
For a full breakdown of video activity by demo, check out our updated Total TV & Streaming Viewership reports for the Ontario and Quebec Franco markets.


Numeris VAM data allows marketers to more accurately determine where viewers spend their time with video; advertisers now have measurement insights into the Canadian “streaming wars,” the reach of individual services, and how they compare to Total TV.
spring 2025 Ontario fall 2024 Ontario spring 2024 Ontario winter 2024 Ontario
spring 2025 Quebec fall 2024 Quebec spring 2024 Quebec winter 2024 Quebec
about VAM ![]()
VAM – Video Audience Measurement – is a cross-platform measurement data set developed and provided by Numeris. VAM captures video consumption from linear television, OTT services and online viewing on all devices and platforms. The data is based on the fusion of the Numeris online and television panels viewing, resulting in cross-platform audience measurement.
VAM currently covers the Ontario and French Quebec markets on a monthly basis (National information not currently available).